Wednesday, November 20, 2013
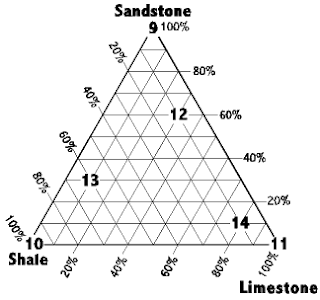
Triangular Plot
Source: http://csmres.jmu.edu/geollab/fichter/SedRx/readternary.html
Triangular Plots are slightly different than other graphs. When I look at them I can't help but think of the map key on unclassed choropleth maps. The triangular plots have 3 corners and each of the corners represents something different. In this example, the 3 corners are sandstone, limestone, and shale. Any data that is not completely in 1 corner is closer to the center. In this case that would mean it is not compose solely of limestone, but maybe contains some shale. While this is similar to unclassed choropleth maps- in that their values are not a range, these graphs do provide numbers to their data.
Subscribe to:
Post Comments (Atom)

No comments:
Post a Comment